Recently I discovered the luftdaten.info project that provides a simple blueprint for measuring particulate matter, and in this post I am sharing how I built and set up my own device and integrated it into Home Assistant.
The project was originally founded in Stuttgart/Germany and has since found many volunteers who created their own particulate matter sensor and share their data with the project. luftdaten.info is aggregating the received data and provides the data for example through an API or on a map.
Home Assistant actually has an API integration with luftdaten.info available but I decided to integrate my own device directly instead of making the detour through the cloud.
Building the Device
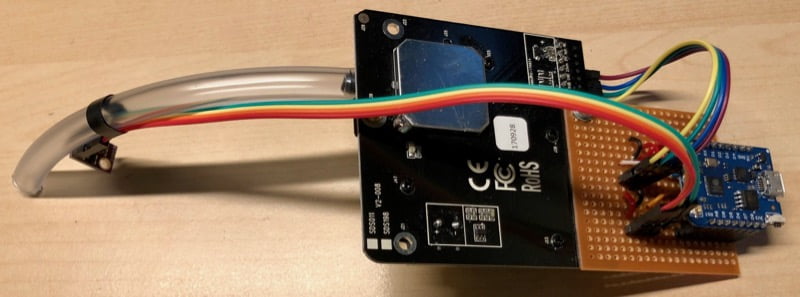
I used a Wemos D1 Mini Pro, a Nova SDS011 particulate matter sensor and a BME280 sensor for measuring temperature, humidity and air pressure. The assembly instructions on the website are pretty straightforward and I even followed their suggestion and used some PVC pipes/elbows for the casing. The details of how to connect the BME280 sensor are described separately in the FAQ section (German only).
Wiring
The following wiring detail basically just reproduces what can be found on the luftdaten.info website, but represents my configuration with the optional BME280 sensor.
| BME280 Sensor | ESP |
| GND | GND |
| VIN | 3V3 |
| SDA | D3 |
| SCL | D4 |
Make sure you connect the BME280 sensor to 3.3V, and the SDS011 sensor to 5V.
| SDS011 Sensor | ESP |
| GND | GND |
| 5V | 5V |
| RXD | D2 |
| TXD | D1 |

Particulate matter sensor
The SDS011 sensor measures two sizes of particles – 10µm or less as PM10, and 2.5µm or less as PM2.5. It comes with a little fan built in to suck in the air and then uses laser detection to measure the amount of particles. According to its data sheet the sensor has a lifespan of about 8000 hours, i.e. if running this continuously you would only get less than one year out of it. Luckily the luftdaten firmware lets you specify the measuring interval and hibernates the sensor in between to increase its life.
Assembly
As usual I used a prototype PCB to expose pin headers for connecting the sensors. I drilled a hole into the PCB to then screw it directly to the SDS011 board to keep the two together in the casing.

As recommended I connected a clear PVC tube to the SDS011 sensor’s air inlet. The end of that tube will be close to the bottom opening of the casing and so I tied the BME280 sensor to that tube.


I bought 2 PVC 80mm socket bend downpipes and sawed off the socket of one of them so that they neatly fit. The 2 PVC 80mm gutter pop outlets will be modified to become lids.

The electronics just fit into the downpipe’s opening.


The tube is just long enough to reach the opening at the bottom.

The sawn-off piece has a cable gland installed at the bottom where I will thread the USB cable through.

To make an insect-proof lid I power-glued PVC mesh to the bottom of each outlet piece that I originally bought as PC cooling fan protection.

All four pipe pieces are held together by small wood screws. And because the sensor will eventually need to survive rainy days I used a bit of thread seal tape for the connection of the two bends at the top of the casing.

Et voilà – the fully assembled device with long USB cable for power, ready to be mounted outside.

Installing software
Uploading the firmware requires a bit more effort, but again the instructions on their website will get you through that part just fine. After this initial upload I configured the device to update its firmware automatically over-the-air, and that has worked fine so far.
At the very first start of the device it creates its own Wifi access point that you can connect to and from there on the configuration of the new device is done through the built-in web UI.
The following screenshot shows the web UI’s home page from where you can access the sensor values as well as the device’s configuration.

Device configuration
The data is sent online to the luftdaten.info API for sharing. Please note that you will need to register your device on the luftdaten.info website so that they can actually make use of your contribution.

In terms of configuring the device you really only need to tick the sensors you have connected. I decided to let the device auto-update its firmware.
The default measuring interval is 300 seconds. Because the SDS011 sensors has a limited lifespan, I would recommend not to measure too often – measuring every 5 minutes should be more than sufficient and increases the life of the device to several years.

And I also store each measurement in a local InfluxDB instance which requires the configuration of the IP address of the server running InfluxDB as well as username and password. I left path and port at their default values. More on the InfluxDB integration with Home Assistant follows below.

Viewing sensor data on the device
After a fresh reboot of the device you will have to wait for the duration of the measuring interval until the first measurement is taking place. The following screen shows that the device is working as expected.

Integration into Home Assistant
Initially I used Home Assistant’s rest sensor to grab sensor data as JSON from the device to then extract the relevant data and display in Home Assistant. However, after a while I noticed that the device was frequently unresponsive for a couple of seconds – I assume while it was spinning up the SDS011 sensor and taking a measure – which in turn then frequently left the sensors showing as “unavailable” in the Home Assistant UI.
Unfortunately the firmware does not have MQTT built in, so I decided to go with the next best option – InfluxDB. I don’t want to go into details on how to set up InfluxDB in this article, but I haven’t really put in a lot of effort myself and just went with the available InfluxDB and Chronograf packages for my Ubuntu server which also hosts Home Assistant.
Retrieving sensor data from InfluxDB
The following Home Assistant configuration snippets are stored in a package file, and I have only split them up here to insert some explanations.
Assuming that all data is nicely flowing from the device into InfluxDB, a influxdb sensor is required. Each query turns into a separate sensor and to find the correct parameters I recommend confirming the details using InfluxDB’s companion Chronograf, but because the luftdaten firmware automatically decided how to name things internally I would expect that the following values should work with the sensors used in my build.
For example, the first query “PM 10 Concentration” looks into the “luftdaten” database and its “feinstaub” measurement which groups all values retrieved from the device. The field “SDS_P1” contains the PM 10 value, and as group_function I selected “last” which returns the last recorded value from the dataset. The where clause limits the query to data retrieved in the last hour which ensures that Home Assistant either has up-to-date data or shows the sensor data as unavailable. In the value_template line I am just rounding the provided value to one decimal.
The second entry “PM 10 Concentration Mean” is based on the same dataset, but calculates the mean (see group_function) of all values retrieved in the last 24 hours.
I then configure two similar queries for the PM2.5 values, followed by temperature, humidity and pressure coming from the BME280 sensor.
Please note that the BME280 sensor provides the actual air pressure value while typically you want to adjust the pressure value to sea level. My sensor is about 200 metres above sea level, and I am using the value_template to adjust the value accordingly. The pressure value stored in InfluxDB is in Pa, and to convert that into more common hPa you will need to divide the value by 100.
The following formula is derived from the BMP180 datasheet and can be used to calculate the pressure at sea level, including unit conversion.

Long story short, I’d recommend to keep the maths in the value_template simple and pre-calculate the divisor (bottom of the fraction).
sensor:
  - platform: influxdb
    username: luftdaten
    password: !secret luftdaten_influxdb_password
    entity_namespace: luftdaten
    queries:
      - name: PM 10 Concentration
        unit_of_measurement: 'µg/m³'
        value_template: '{{ value | round(1) }}'
        group_function: last
        database: luftdaten
        measurement: feinstaub
        field: SDS_P1
        where: 'time > now() - 1h'
      - name: PM 10 Concentration Mean
        unit_of_measurement: 'µg/m³'
        value_template: '{{ value | round(1) }}'
        group_function: mean
        database: luftdaten
        measurement: feinstaub
        field: SDS_P1
        where: 'time > now() - 24h'
      - name: PM 2.5 Concentration
        unit_of_measurement: 'µg/m³'
        value_template: '{{ value | round(1) }}'
        group_function: last
        database: luftdaten
        measurement: feinstaub
        field: SDS_P2
        where: 'time > now() - 1h'
      - name: PM 2.5 Concentration Mean
        unit_of_measurement: 'µg/m³'
        value_template: '{{ value | round(1) }}'
        group_function: mean
        database: luftdaten
        measurement: feinstaub
        field: SDS_P2
        where: 'time > now() - 24h'
      - name: Outside Temperature
        unit_of_measurement: '°C'
        value_template: '{{ value | round(1) }}'
        group_function: last
        database: luftdaten
        measurement: feinstaub
        field: BME280_temperature
        where: 'time > now() - 1h'
      - name: Outside Humidity
        unit_of_measurement: '%'
        value_template: '{{ value | round(1) }}'
        group_function: last
        database: luftdaten
        measurement: feinstaub
        field: BME280_humidity
        where: 'time > now() - 1h'
      - name: Outside Pressure
        unit_of_measurement: 'hPa'
        value_template: '{{ ((value | float) / 97.65179) | round(1) }}'
        group_function: last
        database: luftdaten
        measurement: feinstaub
        field: BME280_pressure
        where: 'time > now() - 1h'
Air quality presentation
The mean value is then used to generate a more tangible air quality representation. In this case I am using the Air Quality Index recommended by the NSW Office of Environment & Heritage. Depending on where you live you may want to use a different way of calculating and presenting the air quality, and Wikipedia has collated air quality index definitions from around the world that may give you some ideas. Just make sure you understand how to calculate the index which usually is not the same as the measured value in µg/m³.
  - platform: template
    sensors:
      # Air Quality Index = (PM10 mean over 1 day / 50) * 100
      air_quality_pm10:
        friendly_name: 'Air Quality PM 10'
        value_template: >-
          {%if ((states.sensor.luftdaten_pm_10_concentration_mean.state | float) * 2.0) <= 33 %}Very Good
		  {% elif ((states.sensor.luftdaten_pm_10_concentration_mean.state | float) * 2.0) <= 66 | float > 33 %}Good
          {% elif ((states.sensor.luftdaten_pm_10_concentration_mean.state | float) * 2.0) <= 99 | float > 66 %}Fair
          {% elif ((states.sensor.luftdaten_pm_10_concentration_mean.state | float) * 2.0) <= 149 | float > 99 %}Poor
          {% elif ((states.sensor.luftdaten_pm_10_concentration_mean.state | float) * 2.0) <= 200 | float > 149 %}Very Poor
          {% elif ((states.sensor.luftdaten_pm_10_concentration_mean.state | float) * 2.0) > 200 %}Hazardous
          {%- endif %}
        entity_id: sensor.luftdaten_pm_10_concentration_mean
      # Air Quality Index = (PM2.5 mean over 1 day / 25) * 100
      air_quality_pm25:
        friendly_name: 'Air Quality PM 2.5'
        value_template: >-
          {%if ((states.sensor.luftdaten_pm_2_5_concentration_mean.state | float) * 4.0) <= 33 %}Very Good
          {% elif ((states.sensor.luftdaten_pm_2_5_concentration_mean.state | float) * 4.0) <= 66 | float > 33 %}Good
          {% elif ((states.sensor.luftdaten_pm_2_5_concentration_mean.state | float) * 4.0) <= 99 | float > 66 %}Fair
          {% elif ((states.sensor.luftdaten_pm_2_5_concentration_mean.state | float) * 4.0) <= 149 | float > 99 %}Poor
          {% elif ((states.sensor.luftdaten_pm_2_5_concentration_mean.state | float) * 4.0) <= 200 | float > 149 %}Very Poor
          {% elif ((states.sensor.luftdaten_pm_2_5_concentration_mean.state | float) * 4.0) > 200 %}Hazardous
          {%- endif %}
        entity_id: sensor.luftdaten_pm_2_5_concentration_mean
Please note that Home Assistant 0.85 introduced a slightly different way of how entity ids are generated from sensor names. If you use an older version, for example the PM2.5 mean sensor would get the entity id `sensor.luftdaten_pm_25_concentration_mean` instead.
Monitoring for firmware version updates
I defined one rest sensor to obtain the current software version. Originally I was planning to implement an automation that gets triggered when the version changes, but because the JSON access is not reliably available, the automation produced too many false alarms. A solution to this could be to improve the rest sensor so that it retries after a short amount of time if the initial connection fails.
  - platform: rest
    name: Software Version
    entity_namespace: luftdaten
    resource: http://<luftdaten device ip address>/data.json
    method: GET
    force_update: true
    scan_interval: 600
    value_template: '{{ value_json["software_version"] }}'
Some final touches
The following bit is required to hide the numeric mean values, and to add some nice cloud icons for the air quality sensors.
homeassistant:
  customize:
    sensor.luftdaten_pm_10_concentration_mean:
      hidden: true
    sensor.luftdaten_pm_2_5_concentration_mean:
      hidden: true
  customize_glob:
    "sensor.air_quality*":
      icon: mdi:cloud-outline
    "sensor.luftdaten_pm*_concentration":
      icon: mdi:cloud-outline
Displaying values in the user interface
For now I simply grouped all sensors in the UI.

Alerting
For now I kept the alerting part fairly simple and just send myself a notification each time the air quality state changes. Due to the long (24 hours mean) time it takes until the air quality state actually changes I am not expecting hat individual outliers at that time make this automation to trigger too often. If it does a simple for with a value of 5 minutes or so should alleviate that issue.
- id: air_quality_pm10_changed
  alias: "Air Quality PM10 Changed"
  trigger:
    - platform: state
      entity_id: sensor.air_quality_pm10
  action:
    - service: notify.pushover
      data_template:
        message: "Air Quality PM10 changed to <font color='#0000ff'>{{ trigger.to_state.state }}</font> (was <font color='#0000ff'>{{ trigger.from_state.state }}</font>).<br/>Air Quality PM2.5 is <font color='#0000ff'>{{ states.binary_sensor.air_quality_pm25.state }}</font>"
        title: "Air Quality Changed"
        data:
          html: 1
- id: air_quality_pm25_changed
  alias: "Air Quality PM2.5 Changed"
  trigger:
    - platform: state
      entity_id: sensor.air_quality_pm25
  action:
    - service: notify.pushover
      data_template:
        message: "Air Quality PM2.5 changed to <font color='#0000ff'>{{ trigger.to_state.state }}</font> (was <font color='#0000ff'>{{ trigger.from_state.state }}</font>).<br/>Air Quality PM10 is <font color='#0000ff'>{{ states.binary_sensor.air_quality_pm10.state }}</font>"        title: "Air Quality Changed"
        data:
          html: 1
Outlook
I can’t really say how accurate the measured values really are, but I could certainly see a significant increase in the particulate matter concentration well above 100µg/m³ during a heavy dust storm we had back in November 2018.
According to its data sheet, the SDS011 sensor is only providing reliable data up to 70% relative humidity. I have occasionally noticed a few outliers during heavy thunderstorms, but no ongoing obvious issues. I’ll continue to observe this, and it may come in handy to have a humidity sensor on board, and take the measured humidity into account, maybe as an indicator for accuracy.
Compatibility
At the time of writing this post, I used:
- Home Assistant 0.85.1 with Python 3.6.7
- luftdaten.info firmware NRZ-2018-123B
- InfluxDB 1.7.2 and Chronograf 1.7.5
- Wemos D1 mini Pro
Update 29 Oct 2019
Today there has been some hazard reduction going on less than 10 kilometres away from our home, and not only could you see and smell the smoke, but the PM10 concentration visibly went up from about 9am this morning.
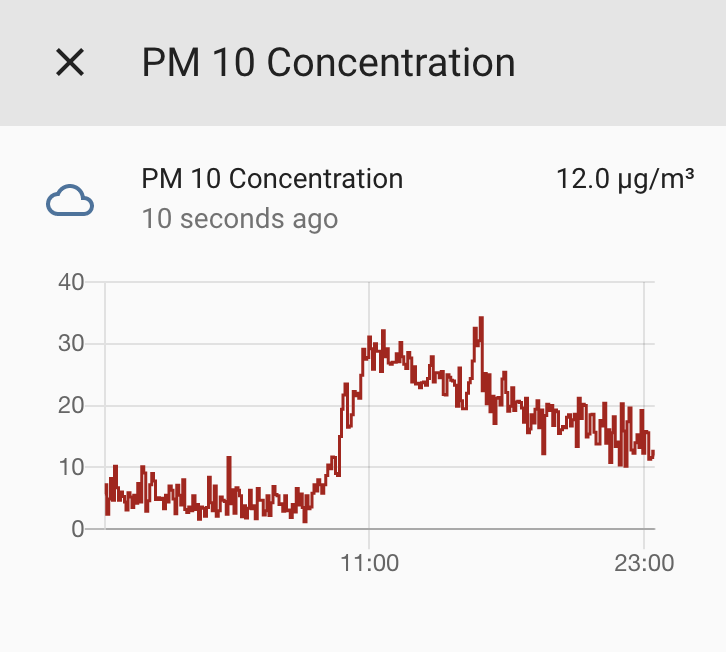
Update 19 Nov 2019
You may have seen in the news that that are currently many bushfires ongoing in New South Wales, some of which in and around Sydney. Over night a lot of smoke has been spreading across the city. Unfortunately, I found a small bug in the sensor configuration that calculates the air quality index correctly. I fixed the configuration above in the meantime. Now my sensors correctly show a “Hazardous” air quality. Time to automatically close the windows – if I had any that I could remote control.
Leave a Reply to malte Cancel reply